So here’s the thing. My old apartment had a single thermostat in the hallway that lied about every other room’s temperature. I’d notice the bedroom felt warmer than the living room and have no data to argue with the landlord about it. One DHT22 sensor and a spare Raspberry Pi later, I had a real-time graph of every room’s temperature and humidity, and the landlord stopped getting away with “the heater is working fine”.
This post is the build I ran for two years before moving. It’s a Raspberry Pi 3 with a DHT22 sensor reporting room conditions, a Python script logging readings to a file, Telegraf parsing the log into InfluxDB, and Grafana drawing the graphs. The whole thing runs on the Pi itself, no cloud services, no monthly fees, and the data is yours.
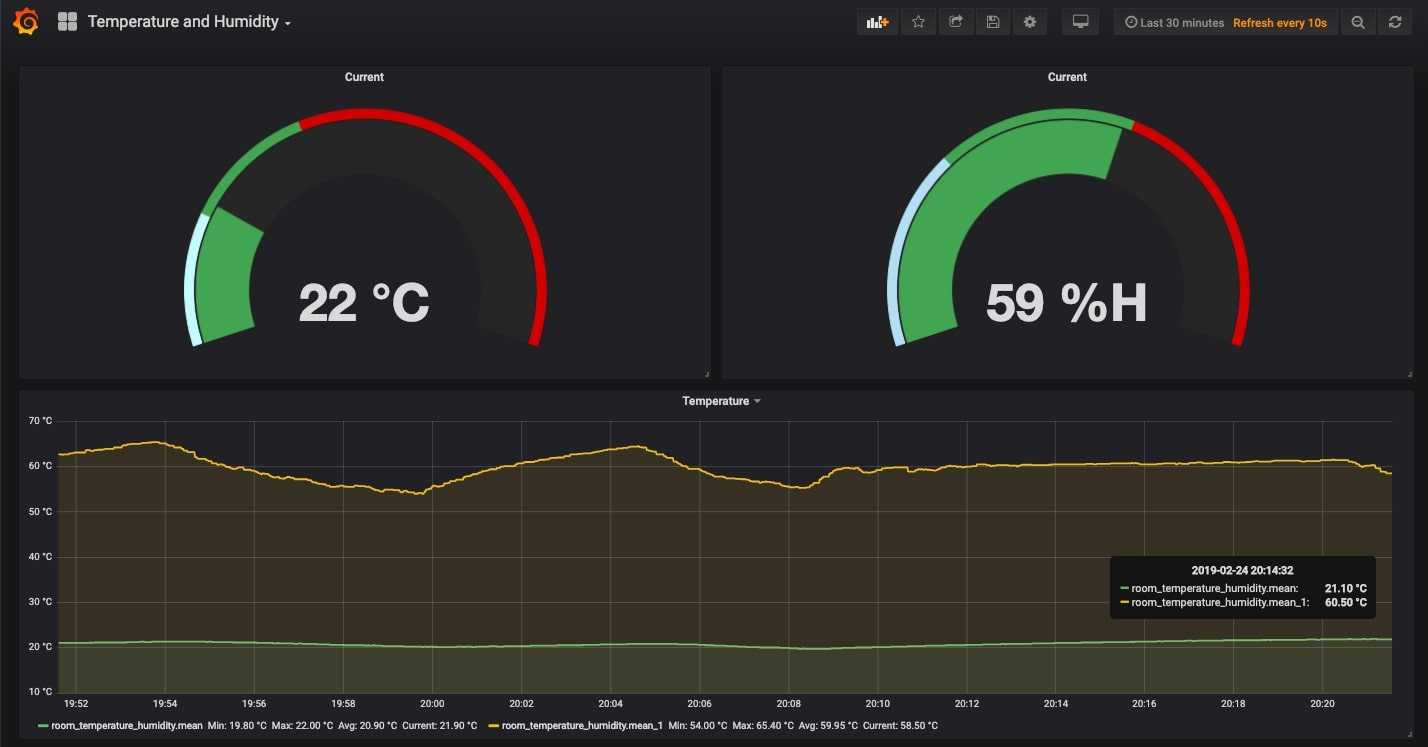
What you’ll build: a self-contained sensor station that reads temperature and humidity every 30 seconds, stores months of history, and shows it on a dashboard you can open from any device on your home network.
Hardware you’ll need
- Raspberry Pi: any model with GPIO. I used a Pi 3, but Pi 4 and Pi 5 work just as well. Pi Zero 2 W works for the sensor side; running InfluxDB and Grafana on a Zero is technically possible but sluggish.
- DHT22 (also sold as AM2302): temperature and humidity sensor. Comes in two variants: a 4-pin “naked” version that needs an external 10kΩ pull-up resistor, and a 3-pin breakout board with the resistor already on it. Buy the 3-pin version unless you enjoy soldering.
- 3 female-to-female jumper wires.
- Power supply for the Pi (official PSU recommended).
- A Pi already running Raspberry Pi OS: if it isn’t, follow the headless setup guide first to get it on the network.
The DHT22 reads -40 to +80°C with about ±0.5°C accuracy and 0-100% humidity with about ±2% accuracy. For room monitoring, that’s plenty. If you want lab-grade precision, look at the SHT31 or BME280 instead; same wiring story, different library.
Wiring the DHT22 to the Pi’s GPIO
Power off the Pi before touching the GPIO header. Static, mis-wires, and shorts on a live board are how you turn a $35 computer into a paperweight.
For the 3-pin breakout (the one I recommend):
| DHT22 pin | Raspberry Pi pin | Purpose |
|---|---|---|
+ (VCC) | Pin 1 (3.3V) | Power |
out (DATA) | Pin 7 (GPIO 4) | Data signal |
- (GND) | Pin 6 (GND) | Ground |
For the 4-pin naked sensor, add a 10kΩ resistor between the VCC pin and the data pin (a “pull-up”), and leave pin 3 disconnected. The driver-board version handles this for you.
Pro tip: the official Raspberry Pi GPIO pinout is the source of truth. Pin numbering is confusing because there are two competing schemes (BCM and physical). Stick to physical pin numbers when wiring; switch to BCM numbers in code (which is why
GPIO 4is BCM-numbered, but it’s at physical pin 7).
Once everything is wired, plug the Pi back in and SSH in:
ssh hemant@raspberrypi.localReading the sensor with Python
The sensor protocol is finicky enough that you don’t want to write it from scratch. The CircuitPython library from Adafruit handles the timing for you. The original Adafruit_DHT library is deprecated; use adafruit-circuitpython-dht instead.
# Update package lists and install build essentials
sudo apt update
sudo apt install -y python3-pip python3-venv libgpiod2

# Create a virtualenv to keep the Pi's system Python clean
python3 -m venv ~/dht22
source ~/dht22/bin/activate

# Install the library
pip install adafruit-circuitpython-dht
Verify the wiring with a quick test script:
# test_dht22.py
import adafruit_dht
import board
import time

sensor = adafruit_dht.DHT22(board.D4)

while True:
    try:
        t = sensor.temperature
        h = sensor.humidity
        print(f"Temp={t:.1f}C  Humidity={h:.1f}%")
    except RuntimeError as e:
        # DHT22 is occasionally flaky; just retry
        print(f"reading failed, retrying: {e}")
    time.sleep(2)
Run it: sudo python3 test_dht22.py. The sudo is needed because GPIO access requires elevated permissions on most Pi OS images. If readings come back, the wiring is good; you should see updates every ~2 seconds.
You could push directly to InfluxDB from Python, but the log-file-then-Telegraf approach has two real benefits. First, Telegraf handles InfluxDB connection retries, batching, and buffering for you. Second, if InfluxDB ever crashes or fills up, your raw data is still in the log file ready to replay.
# log_dht22.py
import adafruit_dht
import board
import logging
import time

logging.basicConfig(
    filename='/home/hemant/temperature.log',
    filemode='a',
    format='%(created)f %(message)s',
    level=logging.INFO,
)

sensor = adafruit_dht.DHT22(board.D4)

while True:
    try:
        t = sensor.temperature
        h = sensor.humidity
        logging.info(f"Temp={t:.1f} C and Humidity={h:.1f} %")
    except RuntimeError:
        # Don't log failed reads; let Telegraf assume continuity
        pass
    time.sleep(30)
Sample log output:
1551010824.434 Temp=24.0 C and Humidity=72.0 %
1551010854.521 Temp=24.0 C and Humidity=72.3 %
1551010884.612 Temp=24.0 C and Humidity=72.5 %
To run this script as a permanent background service, create a systemd unit at /etc/systemd/system/dht22-logger.service:
[Unit]
Description=DHT22 temperature/humidity logger
After=network.target

[Service]
Type=simple
User=root
ExecStart=/home/hemant/dht22/bin/python /home/hemant/log_dht22.py
Restart=on-failure

[Install]
WantedBy=multi-user.target
Then:
sudo systemctl daemon-reload
sudo systemctl enable --now dht22-logger
sudo systemctl status dht22-logger
The logger now starts on boot and restarts itself if Python crashes. Tail the log to confirm readings are coming in: tail -f /home/hemant/temperature.log.
Installing InfluxDB and Telegraf on the Pi
InfluxDB 1.8 is the version this Telegraf config targets. InfluxDB 2.x has a different API and would need a different Telegraf output plugin. For a Pi-scale homelab, 1.8 is fine; the InfluxData install docs cover both.
# Add the InfluxData repo
wget -qO- https://repos.influxdata.com/influxdata-archive_compat.key \
  | gpg --dearmor | sudo tee /etc/apt/trusted.gpg.d/influxdata.gpg > /dev/null
echo "deb https://repos.influxdata.com/debian stable main" \
  | sudo tee /etc/apt/sources.list.d/influxdata.list

# Install
sudo apt update
sudo apt install -y influxdb telegraf

# Start and enable
sudo systemctl enable --now influxdb telegraf

# Verify
sudo systemctl status influxdb
sudo systemctl status telegraf
Create the database InfluxDB will store readings in:
# Open the InfluxDB shell
influx

> CREATE DATABASE temperature
> SHOW DATABASES
> exit
Telegraf config: parsing the log into InfluxDB
Telegraf reads the log file every 30 seconds, applies a grok pattern to extract timestamp, temperature, and humidity, and pushes the values to InfluxDB. Drop this in /etc/telegraf/telegraf.d/temperature.conf:
[agent]
  metric_batch_size = 1000
  interval = "30s"
  collection_jitter = "5s"
  flush_interval = "5s"
  metric_buffer_limit = 10000
  quiet = true

# Bonus: also collect Pi CPU stats
[[inputs.cpu]]
  percpu = false
  totalcpu = true
  collect_cpu_time = false
  report_active = false

[[inputs.logparser]]
  files = ["/home/hemant/temperature.log"]
  fieldpass = ["temperature", "humidity", "timestamp"]
  tagexclude = ["path"]
  from_beginning = true
  name_override = "room_temperature_humidity"

  [inputs.logparser.grok]
    patterns = ["%{TEMPERATURE_HUMIDITY_PATTERN}"]
    custom_patterns = '''
      TEMPERATURE_HUMIDITY_PATTERN %{NUMBER:timestamp:ts-epoch} Temp=%{NUMBER:temperature:float} %{GREEDYDATA}=%{NUMBER:humidity:float}%{GREEDYDATA}
    '''
    timezone = "America/Toronto"

[[outputs.influxdb]]
  urls = ["http://127.0.0.1:8086"]
  database = "temperature"
  retention_policy = ""
  write_consistency = "any"
  timeout = "10s"
Restart Telegraf so it picks up the config: sudo systemctl restart telegraf. Tail the Telegraf log if anything looks off: sudo journalctl -u telegraf -f.
After about a minute of running, query InfluxDB to confirm data is arriving:
influx -database temperature
> SELECT * FROM room_temperature_humidity ORDER BY time DESC LIMIT 5
If you see rows, you’re golden. If not, the most common culprits are: log file path mismatch, grok pattern not matching the log format, or Telegraf running as a user that can’t read the log file.
Installing Grafana and building the dashboard
Grafana on a Pi is a one-liner once the repo is added.
# Add Grafana's repo
sudo mkdir -p /etc/apt/keyrings/
wget -qO- https://apt.grafana.com/gpg.key \
  | gpg --dearmor | sudo tee /etc/apt/keyrings/grafana.gpg > /dev/null
echo "deb [signed-by=/etc/apt/keyrings/grafana.gpg] https://apt.grafana.com stable main" \
  | sudo tee /etc/apt/sources.list.d/grafana.list

sudo apt update
sudo apt install -y grafana

sudo systemctl enable --now grafana-server
Open http://raspberrypi.local:3000 in a browser on the same network. Default login is admin / admin; change it on first login.
Add InfluxDB as a data source: Configuration → Data Sources → Add → InfluxDB. URL http://localhost:8086, database temperature. Click “Save & Test” and you should see a green “data source is working” banner.
Now create a dashboard. New dashboard → Add panel → in the query, set:
- From:
room_temperature_humidity - Select field:
temperature - Group by:
time(30s)andmean()
That’s it. Grafana plots it. Add a second panel for humidity the same way. Save the dashboard, drag panels around, and you’ve got a working real-time graph of your room conditions.
A few panels worth adding once the basics work:
- Single-stat current temp/humidity: a big number that updates live.
- Min/max for the last 24 hours: spot when the heating dropped overnight.
- CPU usage from the Pi itself: free, since Telegraf is already collecting it.
Cost, accuracy, and what I learned running this for two years
Total bill of materials: ~$15 for the DHT22, $0 for the Pi (already had one), $0 for software (everything is open source). Power draw is whatever the Pi already used (~3W on a Pi 3), so no measurable electricity cost.
What worked well. The dashboard ran for 18 months without a single hand-restart. Once a year I ran sudo apt full-upgrade for security patches, and that was it. The DHT22’s accuracy held up fine for room-condition monitoring; cross-checking against a $50 thermo-hygrometer showed the readings stayed within 1°C and 3% humidity, which is well inside the manufacturer’s spec.
What I’d do differently. I’d add a second sensor outside (cheap weatherproof DHT22 housings exist) so I’d have indoor and outdoor on the same graph. I’d also retain less data; six months of 30-second resolution is a lot of disk for what amounts to room temperature. InfluxDB has built-in retention policies for exactly this; setting a 90-day retention with downsampling to hourly averages beyond that would have shaved gigabytes.
Speed bumps to watch for. The DHT22 occasionally returns nonsense values (200°C or 0% humidity); my Python script catches and discards RuntimeError rather than logging garbage. The grok pattern in Telegraf is whitespace-sensitive; if your log format drifts even slightly, parsing silently stops and you end up with an empty database. Tail Telegraf’s logs (journalctl -u telegraf -f) the first time you change anything.
If you’re looking for the next monitoring project after this, the common Linux commands for system monitoring covers the in-shell tools, and the headless Raspberry Pi setup is the prerequisite for any of these Pi-side projects.
Frequently asked questions
Why DHT22 instead of DHT11?
The DHT11 is the cheaper sensor (around $3 vs $7) but its accuracy is much worse: ±2°C and ±5% humidity, with a narrower range. For a room-monitoring dashboard, the difference between the DHT11 reading 24°C and the DHT22 reading 25.4°C is the difference between “this graph tells me something” and “this graph is decoration”. Spend the extra $4.
Can I run InfluxDB and Grafana off-Pi to save the Pi’s resources?
Yes, and for production use you probably should. Replace the urls = ["http://127.0.0.1:8086"] line in the Telegraf config with the URL of your InfluxDB server (a NAS, a Docker host, a cloud VM). The Pi only needs to run the Python logger and Telegraf; the database and dashboard live elsewhere. This also makes it trivial to point multiple sensors from multiple Pis at one central dashboard.
Why use a log file instead of pushing directly from Python to InfluxDB?
Three reasons. First, the log file is your raw data; if InfluxDB ever corrupts itself or you change the schema, you can replay it. Second, Telegraf already handles InfluxDB connection retries, batching, and backoff, so you don’t need to write any of that. Third, decoupling the sensor reader from the database means a database hiccup doesn’t affect the reader, which keeps the readings unbroken.
Does this work with InfluxDB 2.x or InfluxDB 3?
The Telegraf config in this post targets InfluxDB 1.8. For 2.x you’d swap the outputs.influxdb block for outputs.influxdb_v2 and use a token instead of a database name. For 3.x, the recommended approach is to push line-protocol over HTTP. The InfluxData docs cover both; the Pi-side workflow stays identical.
$15 of hardware, free software, and two years of data my old thermostat never gave me. That’s the trade I’d take every time.
Last updated: June 2024